Spatially Correlated Bernoulli Processes

Start Date 01/08/20 - Finish Date 01/08/22
Funding. UKRI 5 Year Turing AI Fellowship ∼£2.6M
Spatially correlated Bernoulli processes using de Bruijn graphs.
I aim to develop a spatially correlated Bernoulli process in n dimensions so that samples from this process have a clustered structure instead of appearing at random. Initial work on a 1-d process (during my PhD) has focused on using de Bruijn graphs, which are somewhat of a generalisation of Markov chains, so that we can control the spread of the correlation. I initially want to extend these ideas to higher dimensions, and then focus on possible applications, for example in classification.
Given a series of Bernoulli trials (or coin tosses) in ‘space’ it is often the case that the successes in nearby trials are more highly correlated than trials far away. We then want to model spatially varying probabilities of success so that the probability of getting a 1 is higher near another 1 (or equally for 0’s). Often such processes are modelled using a logistic regression, which allow the probability of observing a 1 to vary smoothly in space, producing a marginal Bernoulli distribution with probability of success at each point.
If we were to sample a sequence of 0’s and 1’s from these models, we actually neglect any form of spatial correlation, and hence there is a much higher chance for the 0’s and 1’s to appear random in the sample. An example of this is seen in computer modelling or spatial classification. Consider a two-dimensional grid where the input space is split into two separate regions. We can fit a logistic regression to these regions, which gives the probability of being classified into one of the two regions at any point in space. To generate classification predictions, we would sample from an independent Bernoulli distribution at specified input values, where we would expect input points which are closer together to be more likely to be classified into the same region. Drawing marginally, however, gives a much higher chance of misclassifications, especially close to the region boundaries.
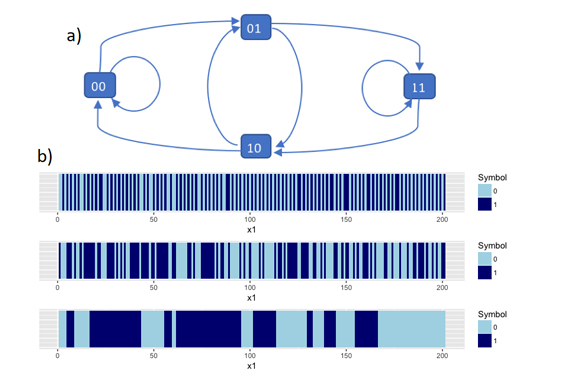
We therefore want to produce a correlated Bernoulli process, and recent work has focused on using the structures in de Bruijn graphs. Given the symbols 0 and 1, a length m de Bruijn graph is a directed graph where the nodes consist of all the possible length m sequences of 0’s and 1’s. Edges are drawn between nodes so that the end of the previous node is the same as the start of the next. Since probabilities can be attached to each edge to show the probability of transitioning from sequence to sequence, de Bruijn graphs can be seen as a generalisation of a Markov chain. The spread of the correlation can be controlled by changing both the size of the node sequences and the transition probabilities themselves. This means that we can create both ‘sticky’ (clustered) sequences and ‘anti-sticky’ (alternating) sequences of 0’s and 1’s. I have worked on producing both a run length distribution and inference. Given a sequence of 0’s and 1’s, we can estimate the de Bruijn process that was most likely used to generate it.
This work has been successful at defining a correlated Bernoulli process in one dimension, ands the next step is to extend this to higher dimensions. This is a difficult problem since the direction associated with de Bruijn graphs does not easily apply to a spatial grid. Initial work has focused on adapting multivariate Markov chains, and/or redefining the form of the dependent de Bruijn sequences. Due to the directional restrictions on a spatial grid, I will also develop a more generalised non-directional de Bruijn process.
Recent Updates
- PhD Thesis (Submitted) 09/04/20
- University of Exeter Internal Seminar 02/06/20
- Isaac Newton Institute Talk 07/19
Collaborators
- Professor Tim Dodwell, Academic Principle Investigator, https://emps.exeter.ac.uk/engineering/staff/td336
- Prof Peter Challenor, PhD Supervisor, https://emps.exeter.ac.uk/mathematics/staff/pgc202
- Prof Henry Wynn (LSE), http://www.lse.ac.uk/CATS/People/Henry-Wynn-homepage
- Dr Daniel Williamson, https://emps.exeter.ac.uk/mathematics/staff/dw356